Running Elasticsearch, FluentD, Kibana (EFK) on OKE
FluentD is the opensource data collector for unified logging layer. FluentD is CNCF graduated project. Kubernetes pods are frequently created, sometimes crash/fail and in some cases the nodes die or may go offline due to node pool upgrade. So the challenge is, as developers the log data is not preserved and not available for future analysis. Thus tools like FluentD becomes so handy for analyzing the logs.
EFK - Elasticsearch, FluentD and Kibana provides a good combination of opensource tool set for providing indexing ,storing and forwarding to nice visualization of viewing searchable logs on graphical user interface.
Since you need stateful storage and log files on the nodes needs to be captured and forwarded on your kubernetes cluster it is advisable to run the fluentD as daemonsets.
Installation
Here is the namespace.yaml
1kind: Namespace
2apiVersion: v1
3metadata:
4  name: kube-logging
Apply the above using the following command
1kubectl apply -f namespace.yaml
Here is the elasticservice_svc.yaml
 1kind: Service
 2apiVersion: v1
 3metadata:
 4  name: elasticsearch
 5  namespace: kube-logging
 6  labels:
 7    app: elasticsearch
 8spec:
 9  selector:
10    app: elasticsearch
11  clusterIP: None
12  ports:
13    - port: 9200
14      name: rest
15    - port: 9300
16      name: inter-node
Apply the above yaml using the following command
1kubectl apply -f elasticservice_svc.yaml
Here is the es_statefulsets.yaml
 1apiVersion: apps/v1
 2kind: StatefulSet
 3metadata:
 4  name: es-cluster
 5  namespace: kube-logging
 6spec:
 7  serviceName: elasticsearch
 8  replicas: 3
 9  selector:
10    matchLabels:
11      app: elasticsearch
12  template:
13    metadata:
14      labels:
15        app: elasticsearch
16    spec:
17      containers:
18        - name: elasticsearch
19          image: docker.elastic.co/elasticsearch/elasticsearch:7.5.2
20          resources:
21            limits:
22              cpu: 1000m
23            requests:
24              cpu: 100m
25          ports:
26            - containerPort: 9200
27              name: rest
28              protocol: TCP
29            - containerPort: 9300
30              name: inter-node
31              protocol: TCP
32          volumeMounts:
33            - name: data
34              mountPath: /usr/share/elasticsearch/data
35          env:
36            - name: cluster.name
37              value: k8s-logs
38            - name: node.name
39              valueFrom:
40                fieldRef:
41                  fieldPath: metadata.name
42            - name: discovery.seed_hosts
43              value: "es-cluster-0.elasticsearch,es-cluster-1.elasticsearch,es-cluster-2.elasticsearch"
44            - name: cluster.initial_master_nodes
45              value: "es-cluster-0,es-cluster-1,es-cluster-2"
46            - name: ES_JAVA_OPTS
47              value: "-Xms512m -Xmx512m"
48      initContainers:
49        - name: fix-permissions
50          image: busybox
51          command:
52            ["sh", "-c", "chown -R 1000:1000 /usr/share/elasticsearch/data"]
53          securityContext:
54            privileged: true
55          volumeMounts:
56            - name: data
57              mountPath: /usr/share/elasticsearch/data
58        - name: increase-vm-max-map
59          image: busybox
60          command: ["sysctl", "-w", "vm.max_map_count=262144"]
61          securityContext:
62            privileged: true
63        - name: increase-fd-ulimit
64          image: busybox
65          command: ["sh", "-c", "ulimit -n 65536"]
66          securityContext:
67            privileged: true
68  volumeClaimTemplates:
69    - metadata:
70        name: data
71        labels:
72          app: elasticsearch
73      spec:
74        accessModes: ["ReadWriteOnce"]
75        storageClassName: "oci"
76        resources:
77          requests:
78            storage: 100Gi
Apply the above yaml using the following command
1kubectl apply -f es_statefulsets.yaml
Here is the kibana.yaml
 1apiVersion: v1
 2kind: Service
 3metadata:
 4  name: kibana
 5  namespace: kube-logging
 6  labels:
 7    app: kibana
 8spec:
 9  ports:
10    - port: 5601
11  selector:
12    app: kibana
13---
14apiVersion: apps/v1
15kind: Deployment
16metadata:
17  name: kibana
18  namespace: kube-logging
19  labels:
20    app: kibana
21spec:
22  replicas: 1
23  selector:
24    matchLabels:
25      app: kibana
26  template:
27    metadata:
28      labels:
29        app: kibana
30    spec:
31      containers:
32        - name: kibana
33          image: docker.elastic.co/kibana/kibana:7.5.2
34          resources:
35            limits:
36              cpu: 1000m
37            requests:
38              cpu: 100m
39          env:
40            - name: ELASTICSEARCH_URL
41              value: http://elasticsearch:9200
42          ports:
43            - containerPort: 5601
Apply the above kibana.yaml using the below command
1kubectl apply -f kibana.yaml
Here is the fluentd.yaml
 1apiVersion: v1
 2kind: ServiceAccount
 3metadata:
 4  name: fluentd
 5  namespace: kube-logging
 6  labels:
 7    app: fluentd
 8---
 9apiVersion: rbac.authorization.k8s.io/v1
10kind: ClusterRole
11metadata:
12  name: fluentd
13  labels:
14    app: fluentd
15rules:
16  - apiGroups:
17      - ""
18    resources:
19      - pods
20      - namespaces
21    verbs:
22      - get
23      - list
24      - watch
25---
26kind: ClusterRoleBinding
27apiVersion: rbac.authorization.k8s.io/v1
28metadata:
29  name: fluentd
30roleRef:
31  kind: ClusterRole
32  name: fluentd
33  apiGroup: rbac.authorization.k8s.io
34subjects:
35  - kind: ServiceAccount
36    name: fluentd
37    namespace: kube-logging
38---
39apiVersion: apps/v1
40kind: DaemonSet
41metadata:
42  name: fluentd
43  namespace: kube-logging
44  labels:
45    app: fluentd
46spec:
47  selector:
48    matchLabels:
49      app: fluentd
50  template:
51    metadata:
52      labels:
53        app: fluentd
54    spec:
55      serviceAccount: fluentd
56      serviceAccountName: fluentd
57      tolerations:
58        - key: node-role.kubernetes.io/master
59          effect: NoSchedule
60      containers:
61        - name: fluentd
62          image: fluent/fluentd-kubernetes-daemonset:v1.4.2-debian-elasticsearch-1.1
63          env:
64            - name: FLUENT_ELASTICSEARCH_HOST
65              value: "elasticsearch.kube-logging.svc.cluster.local"
66            - name: FLUENT_ELASTICSEARCH_PORT
67              value: "9200"
68            - name: FLUENT_ELASTICSEARCH_SCHEME
69              value: "http"
70            - name: FLUENTD_SYSTEMD_CONF
71              value: disable
72          resources:
73            limits:
74              memory: 512Mi
75            requests:
76              cpu: 100m
77              memory: 200Mi
78          volumeMounts:
79            - name: varlog
80              mountPath: /var
81            - name: varlibdockercontainers
82              mountPath: /var/lib/docker/containers
83              readOnly: true
84      terminationGracePeriodSeconds: 30
85      volumes:
86        - name: varlog
87          hostPath:
88            path: /var
89        - name: varlibdockercontainers
90          hostPath:
91            path: /var/lib/docker/containers
Apply the above fluentd.yaml using the following command
1kubectl apply -f fluentd.yaml
Here is the list of all resources created under kube-logging namespace
 1kubectl get all -n kube-logging
 2
 3NAME                          READY   STATUS    RESTARTS   AGE
 4
 5pod/es-cluster-0              1/1     Running   0          1d
 6
 7pod/es-cluster-1              1/1     Running   0          1d
 8
 9pod/es-cluster-2              1/1     Running   0          1d
10
11pod/fluentd-kiju7             1/1     Running   0          1d
12
13pod/fluentd-hgt54             1/1     Running   0          1d
14
15pod/fluentd-kjhgh             1/1     Running   0          1d
16
17pod/kibana-6c98dcf5ff-huyjh   1/1     Running   0          1d
18
19
20NAME                    TYPE        CLUSTER-IP      EXTERNAL-IP   PORT(S)             AGE
21
22service/elasticsearch   ClusterIP   None            <none>        9200/TCP,9300/TCP   1d
23
24service/kibana          ClusterIP   10.87.166.100   <none>        5601/TCP            1d
25
26
27NAME                     DESIRED   CURRENT   READY   UP-TO-DATE   AVAILABLE   NODE SELECTOR   AGE
28
29daemonset.apps/fluentd   3         3         3       3            3           <none>          1d
30
31
32NAME                     READY   UP-TO-DATE   AVAILABLE   AGE
33
34deployment.apps/kibana   1/1     1            1           1d
35
36
37NAME                                DESIRED   CURRENT   READY   AGE
38
39replicaset.apps/kibana-uhyg6578j   1         1         1       1d
40
41
42NAME                          READY   AGE
43
44statefulset.apps/es-cluster   3/3     1d
Here is the view of persistent volume it created
1
2kubectl get pv
3
4ocid1.volume.oc1.ca-xxx-1.yyy   100Gi      RWO            Delete           Bound    kube-logging/data-es-cluster-0                   oci                     1d   Filesystem
5
6ocid1.volume.oc1.ca-xxx-1.yyy   100Gi      RWO            Delete           Bound    kube-logging/data-es-cluster-2                   oci                     1d   Filesystem
7
8ocid1.volume.oc1.ca-xx-1.yyy   100Gi      RWO            Delete           Bound    kube-logging/data-es-cluster-1                   oci                     1d   Filesystem
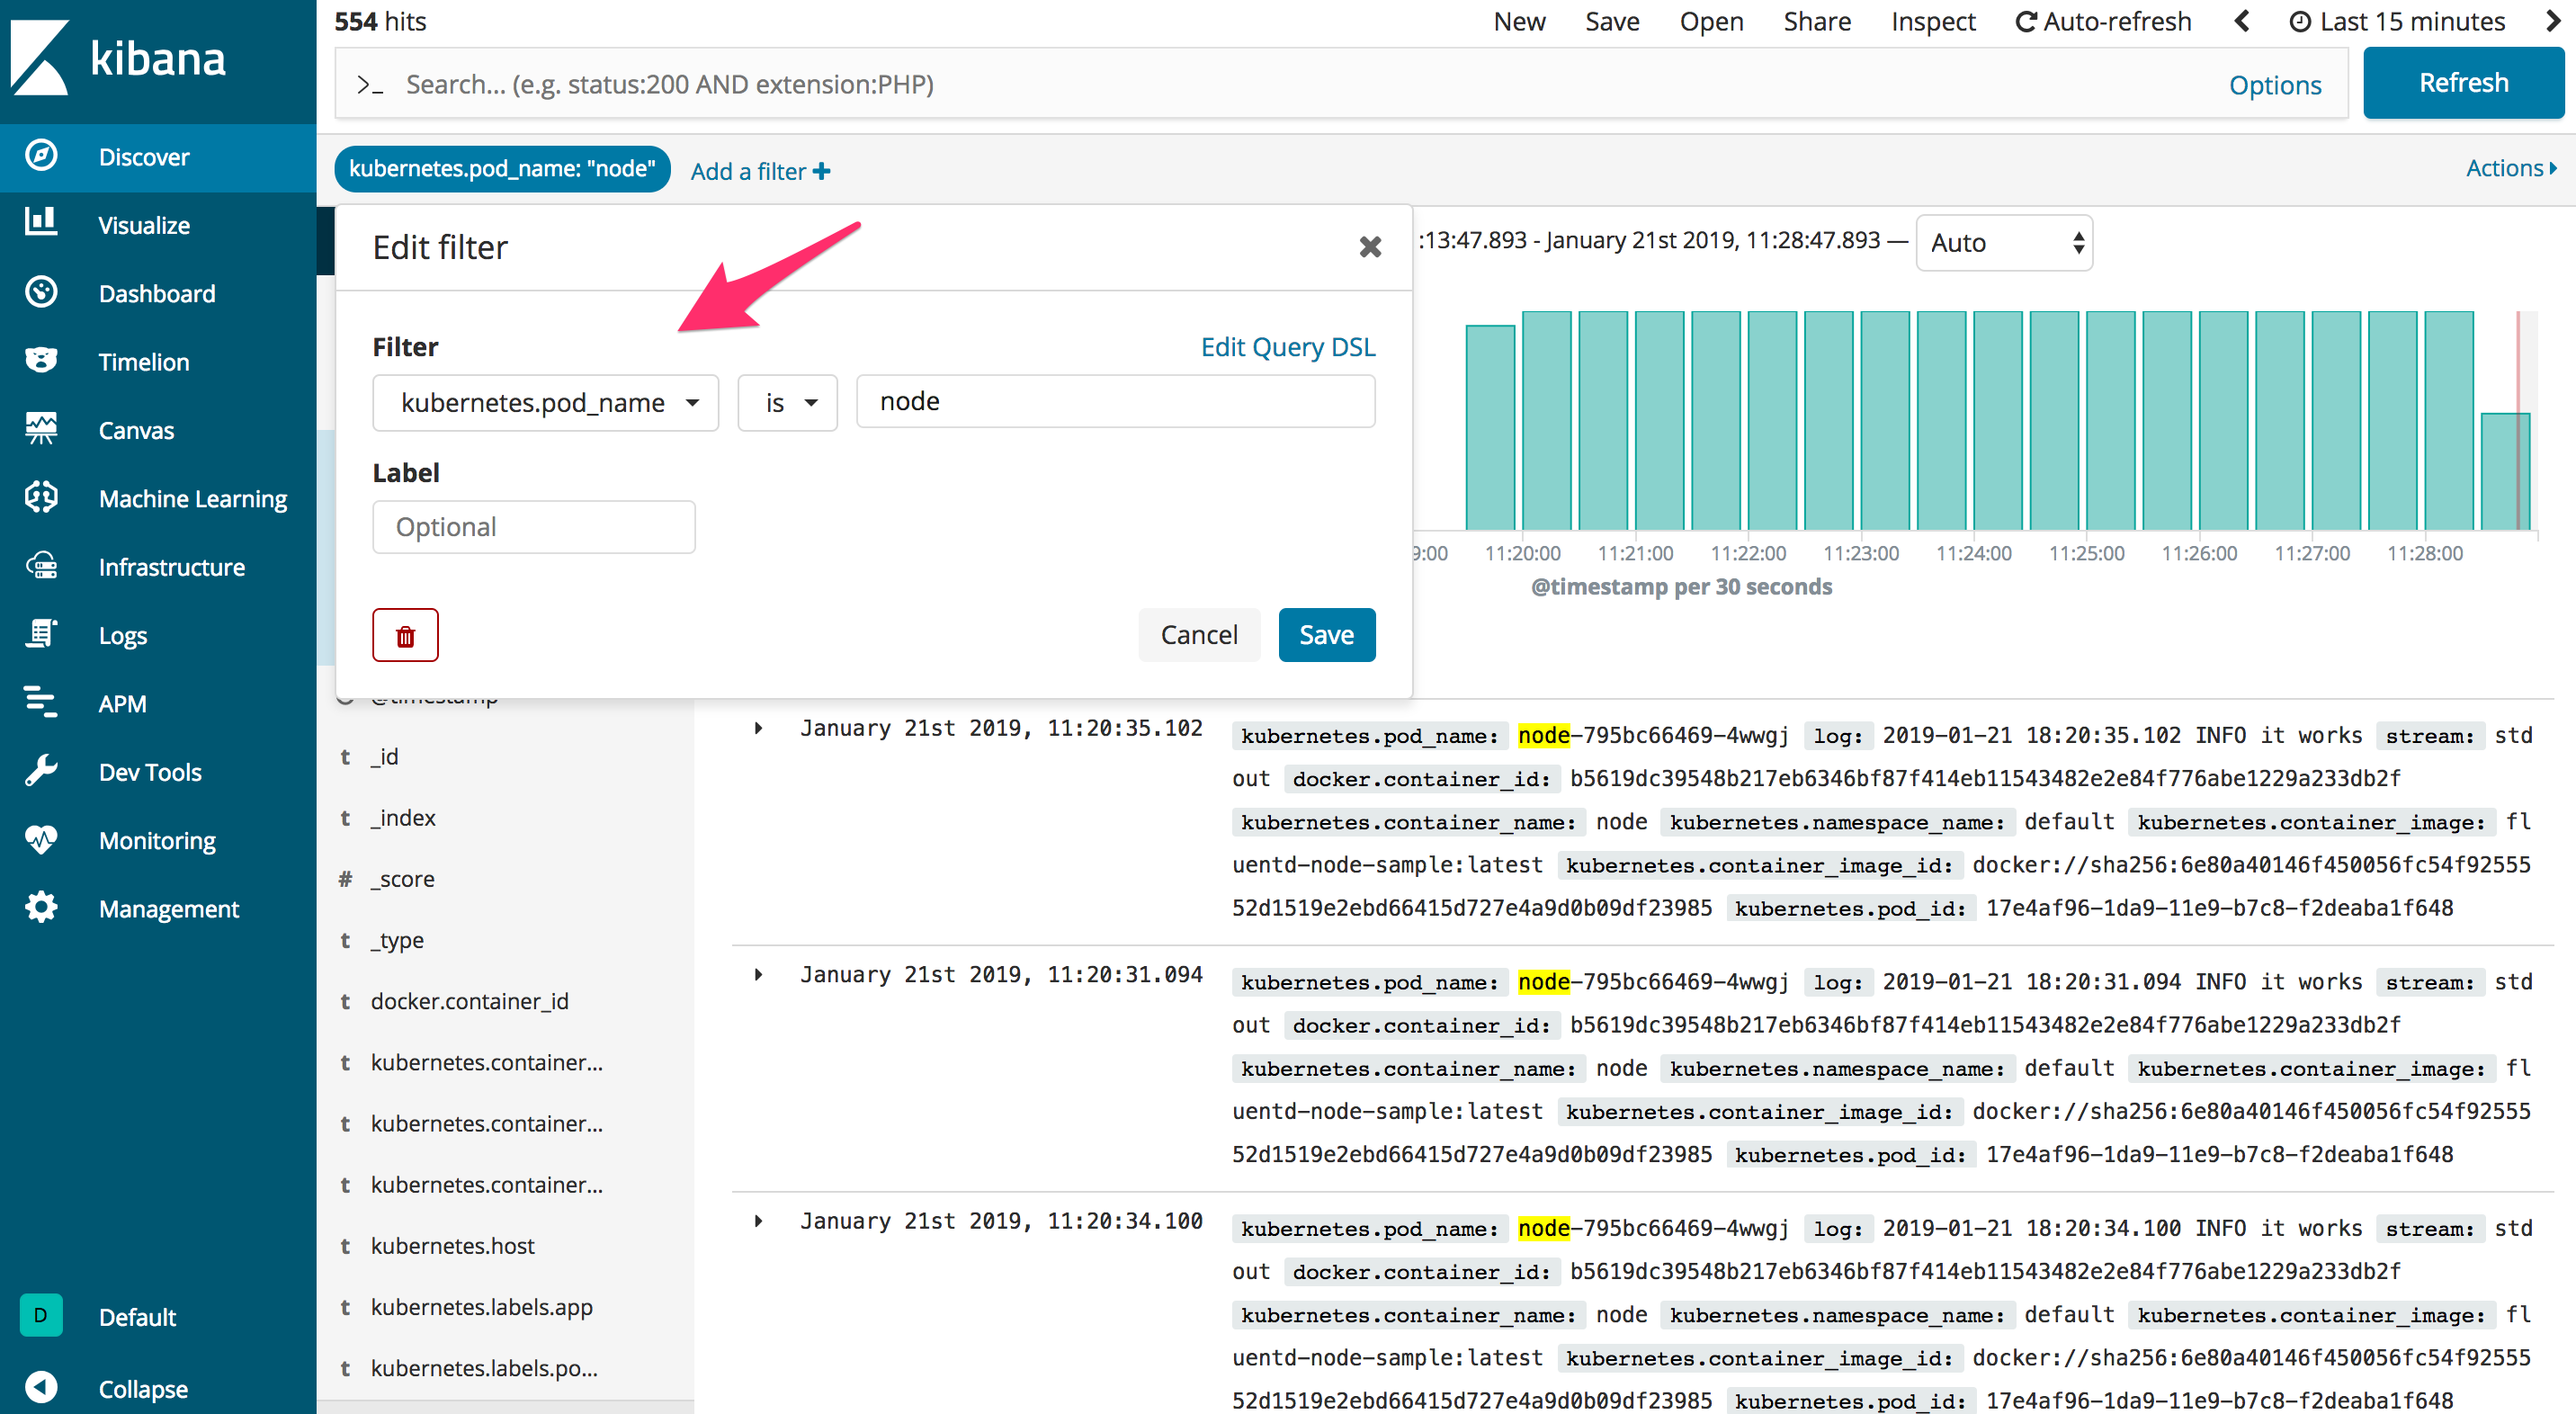
Once you confirm all the resources and pv's created then issue the following command to pull the grafana dashboard
1kubectl -n kube-logging port-forward \$(kubectl -n kube-logging get pod -l app=kibana -o name) 5601:5601
To open the dashboard point the browser to http://localhost:5601